
What school absence trends do you believe AI can spot that current methods cannot, to improve coordination between education, social care and the wider services that support families?
Since the pandemic, conservative leaning organisations and most notably the CSJ, have been banging a drum very loudly about children not in school. This is not about private-school educated children, but children they expect be in state educational settings age 5-18. Often, other people’s children.
In recent debate, various sub-categories of children not in school are conflated together. In 2022, various stakeholders got together and with Defend Digital Me, we worked to point out in non-partisan way, where that thinking was wrong.
It is wrong on who is not counted. (And who is). It is wrong on assumptions built into conflating the differences between children not in school and children ‘not in receipt of suitable education’. It is wrong on assumptions that children not in school are not already on registers and recorded on Local Authority databases. It is wrong to ignore that the definition of persistent absence means children are classified as persistently absent more quickly now than previously. The same number of children could be absent for the same number of school days as were a decade ago, but it will be reported as having doubled.
And it is arguably morally wrong, in ignoring a very significant part of the problem as they see it: why children are not in school once you remove all that is wrong with the counting and assumptions. And what are the consequences for children of forcing them to be without their consent, or respecting families choice or agency?
Absence data (on school roll, not attending)
In the 2023/24 academic year up to 8 December 2023, DfE data shows that the attendance rate across the academic year to date was 93.4%. The absence rate was, therefore, 6.6% across all schools and the unauthorised rate was far less. By school type, the absence rates across the academic year 2023/24 to date were:
- 5.1% in state-funded primary schools (3.7% authorised and 1.4% unauthorised)
- 8.3% in state-funded secondary schools (5.2% authorised and 3.1% unauthorised)
- 12.6% in state-funded special schools (9.5% authorised and 3.0% unauthorised)
Over 1.5 million pupils in England have special educational needs (SEN)
An increase of 87,000 from 2022. Both the number of pupils with an education, health and care (EHC plan) and the number of pupils [recorded] with SEN support have increased:
- The percentage of pupils with an EHC plan has increased to 4.3%, from 4.0% in 2022.
- The percentage of pupils with SEN but no EHC plan (SEN support) has increased to 13.0%, from 12.6% in 2022.
Both continue a trend of increases since 2016. As do the number of stories you hear of parents asked to bring in children only part-time because the schools cannot get EHC plans approved, (Local Councils have no money) without which, schools cannot access funds or allocate the staff and resources needed for that child in a school.
Which children are not in school?
The concept of children-not-in-school should be nothing at all to do with Elective Home Education (“EHE”). The premise of ‘not in school’ is that they are not attending school ‘but they should be’ and that action taken will be as a result. Elective Home Education (“EHE”) children are not on a school roll and not expected to be. No action should be taken as a result, to get them into schools.
A Guardian article today (Jan 9th) quotes Wendy Charles-Warner, chair of home education charity Education Otherwise, who sums up one problem here: “Yet again we see an inappropriate and frankly mangled conflation of [elective] home education and absenteeism.
“Home education is of equal legal status to school education and it is certainly not ‘non-attendance’. Home educated children are in full-time education, they are not school pupils let alone absent school pupils.
“A register of home-educated children will make no difference whatsoever to school absenteeism and, before proposing such a significant step, the Labour party should educate itself to the very basic facts of the matter.”
It was frustrating to hear Bridget Phillipson give the same impression today as many other MPs had in the 2022 debates on the Schools Bill but using selective evidence, that no one knows how many children are home educated. Every Local Authority we asked data for in 2021-22 that replied, already had a register of EHE.
Proposals to legislate for a new national register of children not in school were part of the Government’s now-scrapped Schools Bill and were hotly contested and debated in the House of Lords. There is no compelling case to have one.
We assessed the plans at Defend Digital Me as part of the Counting Children coalition, and not only were the policy issues pretty fundamentally flawed, but practically flawed too. The legislation on the database as set out would have meant for example, double counting a whole swathe of children already on school registers but in Alternative Provision or part-time.
The plans conflated Home Education (“EHE”) (not on school roll) with absenteeism (pupils registered on school roll but absent), and would have doubled counted some children who were part time at alternative school settings, and conflated these children with Children Missing Education (“CME”, not on a school roll and it has been assessed that they are ‘not in receipt of a suitable education otherwise’, so should be on a school roll but are not and who are known to the State); and further conflated those three groups with children not on any database at all (unknown to the state education system).
Piling in elective home educators with at-home children waiting for places or suitable state school services, with children already on roll but part-time and truancy, would have geared up to conflate a toxic mix of ‘victims’ and ‘perpetrators’ style narrative like the Met Police Gangs matrix, people to be treated with suspicion and requiring additional (often centralised) state surveillance, all as a result of what would have been bad numbers.
The not-in-school register plans angered many, among others, the Charedi community. Home Educators protested outside parliament and filled the public gallery in the House of Lords on the day it was most specifically debated in the Schools Bill.
I know of cases where children are wrongly labeled CME by Local Authorities. Some LAs cannot (for what seems like nothing but stubborn jobsworth bureaucracy) accept that children who are Home Educated can be in receipt of suitable education, even if an LA’s opaque methods of measuring ‘suitability’ are so arbitrary and intrusive and out of step with the law as to be only understandable to them. Such records create fundamentally flawed and inaccurate family portraits, turning EHE records into CME records mid-year, (spot the double counted child) without recourse or route for redress. Some of these data are therefore opinions, not facts. Automating any of this would be a worse mess.
Known-to-the state CME children are on Local Authority databases even if If they were never enrolled at a school. If they were in school and left and even if after doing so they ‘fall off the radar’, one of fifteen tick-box reasons-for-leaving is recorded on their detailed named record and kept. If they disappear without a known destination of the next educational setting, they will in addition be added into the part of the Common Transfer File system that posts children’s records into the Lost Pupils Database (LPD). They are pulled out of that LPD once a state school ‘receives’ them again.
Children about whom nothing is known by the state, the so called ‘invisible children’ cannot be magically added to any database. If they were known today, they would already be on the existing databases. It is believed there are very few of these, but of course, it is unknown. It also by default a number that cannot ever be known. The NCB and Children’s Commissioner have made guesstimates of around 3,000 individual children.
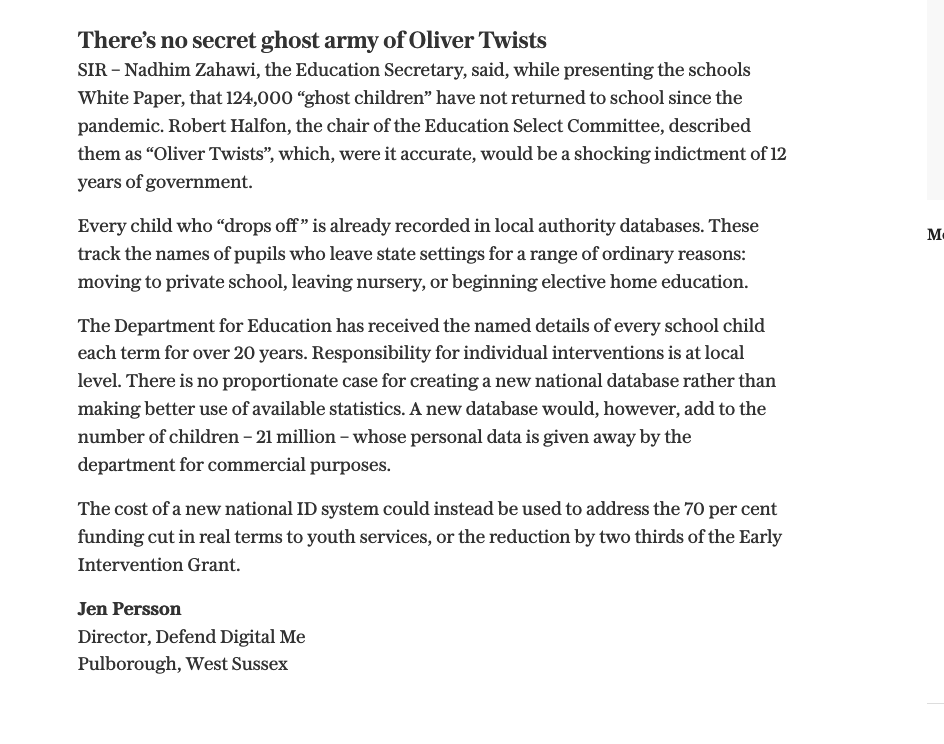
The CSJ has in my view whether accidentally or by intent, wrongly hyped up the perception of the numbers of those children, by inventing the new term “ghost children”. This has made the everyday listener or MP think of these as ‘unseen by the state’. This CSJ term has been sweepingly used in the media and parliament to cover any child not in school and means the perceived “problem” is wrongly seen as (a) one and the same thing and (b) much larger than in reality.
That reshaping of this reality matters. It’s been a persistently retold half-truth since 2021 (the Telegraph published my letter to the editor on it in March 2022). Still it seems not easily fixed by fact alone. The costs of new databases duplicating data that already exist, would be far better spent on patching up the 70% cuts to Local Authorities youth services, CAMHS, or Early Intervention Grant, or basically anything else for children and young people or families.
Which children do we know should be in school?
Remembering that the claims are that we need new registers of children not-in-school, how many children do you think are known to be missing education, recorded as CME, in any one Local Authority? Yes, these children are recorded by name already at LAs.
Local authorities have a duty under section 436A of the Education Act 1996 to make arrangements to identify, as far as it is possible to do so, children missing education. What is possible, is already done.
There are currently 152 local education authorities in England and through the dedicated volunteer effort from the Counting Children coalition, we asked all of them for their data (as of June 30, 2021).
There were zero Children Missing Education (“CME”) in Powys, Wales. In Blackpool by contrast lots. There were 45 Children Missing Education (“CME”) (in the area waiting for provision to start, mainly recently arrived), 112 Children missing “Out” (left area being tracked) (of which 61 had been located) and 307 Elective Home Education (“EHE”). And across the academic year September 2020 – July 2021, the Isle of Wight recorded 49 children as Children Missing Education (CME), in East Riding there were 17 Children Missing Education (“CME”). In Leicester they even noted that children on their registers have been recorded in these ways since 2003.
Do those numbers surprise you? Local Authorities also collect a lot of data already about each child out of school. For example, Harrow’s central database on children not in school already includes Family Name, Forename, Middle name, DOB, Unique Pupil Number (“UPN”), Former UPN (For adopted children and children-at-risk this should not be so, but who knows if it is respected see 6.5 and 6.6 due to risks the UPNs create for those children — The UPN is supposed to be secure state identifier, and as such, has special protections including being a blind identifier and it should lapse when children leave school (see page 6-8). There is also the Unique Learner Number (ULN).
Any new number policymakers suggest inventing, would need to be subject to the same protections for the child (and throughout their adult life), and therefore it would serve little purpose to create yet another new number.
The list goes on, of what is collected in CME Local Authority databases on each named child. Address (multi-field), Chosen surname, Chosen given name, NCY (year group), Gender, Ethnicity, Ethnicity source, Home Language, First Language, EAL (English as additional language), Religion, Medical flag, Connexions Assent, School name, School start date, School end date, Enrol Status, Ground for Removal, Reason for leaving, Destination school, Exclusion reason, Exclusion start date, Exclusion end date, SEN Stage, SEN Needs, SEN History, Mode of travel, FSM History, Attendance, Student Service Family, Carer details, Carer address details, Carer contract details, Hearing Impairment And Visual Impairment, Education Psychology support, and Looked After status. (For in school children, the list is even longer, it lasts a lifetime, and it’s given away too).
Yet the Schools Bill would have granted Local Authorities powers to expand this already incredibly intrusive list to any further data at all of their choosing, without any limitation.
The CSJ perhaps most accurately, states in one report, that it is vulnerable children who are affected most by missing school time but this must not be conflated with Children Missing Education.
“In Autumn 2022, the latest term for which data is available, children in receipt of Free School Meals (FSM) had a severe absence rate which was triple the rate for children who were not eligible for FSM. Children in receipt of special educational needs (SEN) support are also more likely to be severely absent than their peers.”
Absenteeism and Children Missing Education are NOT the same. From the numbers above, I hope it is clear why.
The perception of reality matters in this topic area specifically because it is portrayed by the CSJ as an outcome of the pandemic. The CSJ is not politically neutral given its political founders, steering group and senior leadership with strong ties to the lockdown-skeptic COVID Recovery Group. That matters because it influences, and enables other influencers, to set the agenda on what is seen as cause and solution to a set of problems and the public policy interventions that are taken or funded as a result. In 2022 at the Tory party conference event on this subject which I also wrote up afterwards here, Iain Duncan Smith failed to acknowledge, even once, that thousands of people in the UK have died and continue to die or have lasting effects as a result of and with COVID-19.
It was such a contrast and welcome difference from the tone of Bridget Phillipson MPs speech today at CSJ, that she acknowledged what the pandemic reality was for thousands of families.
And after all, according to a King’s Fund report, “Overall, the number of people who have died from Covid-19 to end-July 2022 is 180,000, about 1 in 8 of all deaths in England and Wales during the pandemic.” Furthermore in England and Wales, “The pandemic has resulted in about 139,000 excess deaths“. “Among comparator high-income countries (other than the US), only Spain and Italy had higher rates of excess mortality in the pandemic to mid-2021 than the UK.”
At the 2022 Conservative Conference fringe event, chaired by IDS, while there were several references made by the panel of the impact of the pandemic on children’s poor mental health, no one mentioned the cuts to youth services’ funding by 70% over ten years, that has allowed CAMHS funding and service provision to wither and fail children well before 2020. The pandemic exacerbated children’s pre-existing needs that the government has not only failed to meet since, but actively rationed and reduced provision for. Event chair, Ian Duncan Smith, is also the architect of Universal Credit. And this matters in this very closely connected policy area for measuring and understanding the effectiveness of all these interventions.
Poverty and school attendance can but do not always have causes and correlations. But while we focus on the (inaccurately presented) number of children not in school we fail to pay attention to the Big Picture and conflated causes of children not in school. Missing bums on seats is not the problem, but a symptom. In some cases, literally. Historically, the main driver for absence is illness. In 2020/21, this was 2.1% across the full year. This was a reduction on the rates seen before the pandemic (2.5% in 2018/19).
What does persistent absentee mean?
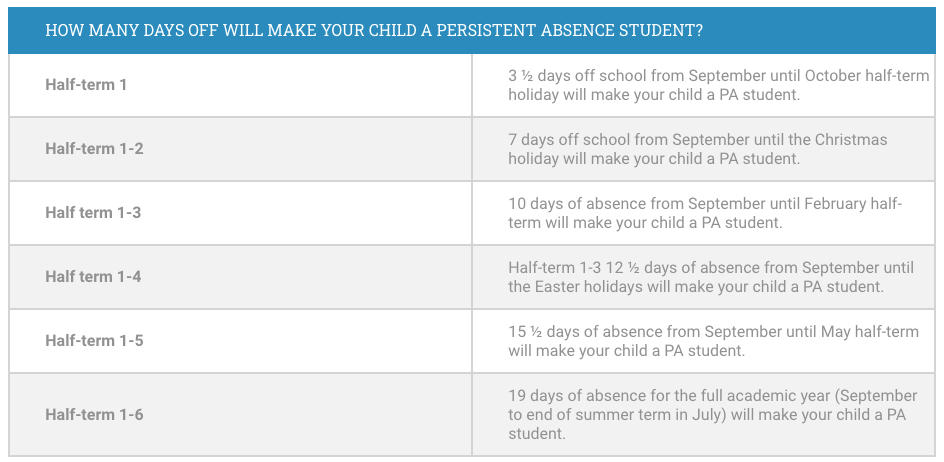
Another part of these numbers often presented in the media is the ‘persistent absence’ rate. But is it meaningful? In 2018/19 the rate of persistent absentees (missing 10% of possible sessions, or the equivalent of one morning or one afternoon every week) was 10.8%. Now it is reported as around double that. But bear in mind that at any point in time, the label ‘persistent absentee’ may be misleading to the average man-on-the-street.
Don’t forget this is also a movable numbers game — understanding the definition of persistent absence and that it has changed three times since 2010, are both critical to appreciate the numbers and data used in discussing this subject. Children are classified as persistently absent more quickly now than previously. The same number of children could be absent for the same number of school days as was a decade ago, but will be reported as having doubled.
A child who misses a full day in the term for unauthorised absence (illness) now stays marked as ‘persistently’ absent until their percentage of possible sessions in school outweighs the 10% missed. So if they have 3.5 days of tummy bug or flu which every parent knows is pretty much the norm on “Back-to-School” then even the most dedicated pupils look ‘persistently’ absent for quite a while. It’s not only guilt inducing to the students who care, it creates stress to go-in-at-all-costs (including before recovery with risk of infection) for the ill, and stigmatises the disabled and those with long term health conditions.
A label unfit for purpose, it could usefully be re-named and the topic re-framed to rebuild trust with learners and families.
Another technical thing that could usefully be updated in terms of data collection is the inconsistency across Local Authorities for what age group they record which data. For example, children missing education (“CME”) is often Reception through to age 16 but for other categories it is for children to age 18, and age 25 for children with a special educational needs and disability (SEND) plan into young adulthood. Many Local Authorities use the definition in section 8 of the Education Act 1996 that is out of step with the more recently revised school leaving age in England.
Data-led decisions are not smart solutions
This is fundamentally not about data, but children’s lives. In these debates there is a grave risk that a focus on the numbers, because of the way the data is presented, perceived, or used, means that reducing the numbers themselves becomes the goal. The data is there. Joining it all up may feel like doing ‘something’ but it’s not going to contribute anything to getting bums on seats or deliver a quality education to every child. It won’t contribute to a solution except perhaps to some AI company CEO’s bottom line. And at what cost to children both by what you choose not to instead or direct harm? AI is not the solution or even a reliable tool when it comes to children’s social issues.
Entering data on a system with the hope of ‘spotting patterns’ without precise asks of data is rather like gazing at a crystal ball. The computer cannot ‘guess’ what you are looking for. Rather than designing for the effective outcomes of what you want it to achieve, is symptomatic of the analysis of the problem. Lack of human authority and accountability.
It was said in the Laming report of the Victoria Climbié enquiry, there could be referrals coming in by fax, streaming on the floor and nobody picking them up. “It was not my job to pick up the fax from the fax machine. It was not my role. I had other things to do.” (5.22) All staff working in children and families’ services don’t need to be on one database to record data, but can work on decentralised systems with single role-based access. Systems can draw together data and present it without the need for a single record. Those are design questions, not a justification for building more databases and more national identifiers which may do nothing but duplicate the existing dysfunctions.
The Laming Review found that by the late 1990s social services had lost all of its human resources and training staff. They were overworked and missed things the computer showed them. Computers cannot make people do their job. Access to information does not create accountabilty for action.
In Victoria’s case, one example given was of a computer printout displaying a unique child reference number, that noted physical bruising. The links were there for anyone who had access to see:
“but it seems likely that as the administrative staff were struggling to cope with the backlog of work at the time, it was simply overlooked.”
Children can experience the concentrated harms of poverty more than many in society. Some by government policy design. The data on child poverty is sometimes contradictory. But it is obvious to see that child poverty is not only more widespread but deeper now, than it was when the Conservative party took power in 2010. And it is important to consider a third further factor in the overlap between children’s school attendance and child poverty. Amos Toh, senior tech and human rights researcher at Human Rights Watch wrote recently on AI and public policy,
“As part of the welfare system since 2010, the government has ceded control of the country’s social assistance system to algorithms that often shrink people’s benefits in unpredictable ways. The system, known as Universal Credit, was rolled out in 2013 to improve administrative efficiency and save costs, primarily through automating benefits calculations and maximizing digital “self-service” by benefit claimants.”
Universal Credit has had a range of contested outcomes but what should be uncontested is that the AI, the algorithms it uses, are flawed in various ways in various parts of the system.
So when I heard Shadow Education Secretary Bridget Phillipson say today that, “artificial intelligence (AI) will be used by Labour to spot absence trends to improve coordination between education, social care and the wider services that support families,” and, “plans to legislate for a new register of children in home education,” what I think to myself is this. Regardless of which political party is in power, imagine if there were a (duplicated) new database of children who are home educated and/ or known to be missing education at national level. Once these statistics are available at national level in one database (after all, only statistics not named records might be seen as necessary and proportionate beyond direct care, and practically the data will always be out of synch with local data), and imagine the money has not been spent on youth services, or Early Years intervention, but on ‘fix-it-all’ AI. What will change?
Fixing Britain is a People Problem
If you have followed the BBC Radio 4 Louise Casey ‘Fixing Britain’ series, you may or may not agree with all the suggestions but in the episode on Universal Credit, the summary is relevant for all of them. Often a public policy focus on money and legislation, forgets what it is about, people. “Policy disconnected from its purpose [people] is going to fail.” Policy makers often fail to understand most people’s lives whom the policy is intended to affect. Some of that today looks like this:
On poverty: There are far more food banks in the UK than branches of McDonalds.
On school leavers’ aspirations and opportunity: One third of children fail to get a pass in maths and English GCSE that is the gatekeeper to many jobs. AI-supported recruiting tools simply sort out and remove those who don’t have the qualifications in the applications process. Today one third of children are excluded from education and job opportunities not because they are necessarily unsuitable applicants, but because the grade boundaries are set so that one-third get D or lower.
On bad parenting: too often conflated into this debate by the Children’s Commissioner, children not-in-school is not a sign of bad parenting, any more than a child sent into school is a good one. Even joined up professional services and home visits can still be fobbed off and still fail to act on signs of neglect and abuse. Parents and children on the radar of social services and on school rolls and in-school are known to the system and yet still it fails due to ‘underfunding of social services and the court system’.
On cuts to human support: Social workers vacancies were reported at a record high of 7,900 in 2022, a 21% rise on 2021. “The risks have been shown in safeguarding reviews after a series of scandals. A review of Bradford’s children’s services following Star Hobson’s death found record levels of vacancies and sickness among social workers.” No amount of data or Artificial intelligence can plug that hole in human capacity.
On policy aims: Much of this has been debated again and again. From twenty years ago, to the 2023 House of Commons Committee report on Persistent absence and support for disadvantaged pupils.
On children: Above all, contrary to some narratives, what is in a child’s best interests is not always being in school. If you ask primary children what they like and don’t like about school it may have changed little over time because what matters to them most is how it makes them feel. Some love sport, drama, music and art and are frustrated there is so little of it, and none at all from age 13 where the curriculum narrows to KS4 too early. For many it is not safe or supportive of their needs. Some are not fine in school and some need specialist support. Expert individuals and oganisations identify those needs and are there to help. Children may more rarely be offered a choice or asked if they want to be in school, but without a consensual part in it, it doesn’t work.
On fault: Blame is then too often laid at parents’ feet, whether it is the narrative of parents are either feckless or failing to teach children to brush their teeth. In the year of a General Election how will this land with people who voted for the narrative, “Take back control”?
Control and choice
It was refreshing to hear Phillipson move at least a bit away from blame to responsibility and trust. The role of responsibility and trust in the system are, however, unevenly distributed and possibly under appreciated. Perhaps coincidentally, many parents and teachers today, are the first who went through the biggest costs and still have the largest debts owing from their Higher Education. As reported by politics.co.uk, “the results of the annual Higher Education Policy Unit and the Higher Education Academy student experience study in 2017 showed that just 35% of respondents believed their higher education experience represented ‘good’ or ‘very good’ value for money.” If parents see and act as if education is less of a gift in life or a public good, but more of a package that comes with consumer rights attached, then can you blame them? It was Labour that introduced the first student fees for Higher Ed.
It was the Conservatives who made ‘choice’ in the schools market central to their messaging on the role of parents in education for a decade. In the US they are now seeing the results of that ‘choice’ message, made even more extreme through per pupil cash transfers, and by the political culture war divisions driven between communities and state schools that has helped steer state money away from the mainstream state school system.
Phillipson is right on why the current government approach isn’t working, “that broader reality is why the government’s approach – an Attendance Action Alliance – falls so far short of the challenge. Insofar as it tackles anything, it tackles the symptom, not the causes.”
But tackling things via different but wrong tools, won’t be better.
Failing to heed lessons from infrastructure projects, on pupil data, and AIs past and present, dooms us to repeat the same mistakes. Who is in school is an outcome of the experience of the system at individual level, and if it delivers in the context of each child’s, family, and community life and the aims and quality of education. Focusing only on getting children into the classroom is of little value without understanding what the experience is like for them once there. The outcomes of children not-in-school is not only a societal question, but one of long term sustainability for England’s state school system as a whole.